CoursesBackend engineering from first request to production
Puzzle 15 · 16 of 18
Which users felt the slowdown?
Compare request durations, failures and resource pressure.
All puzzles in this course
The problem
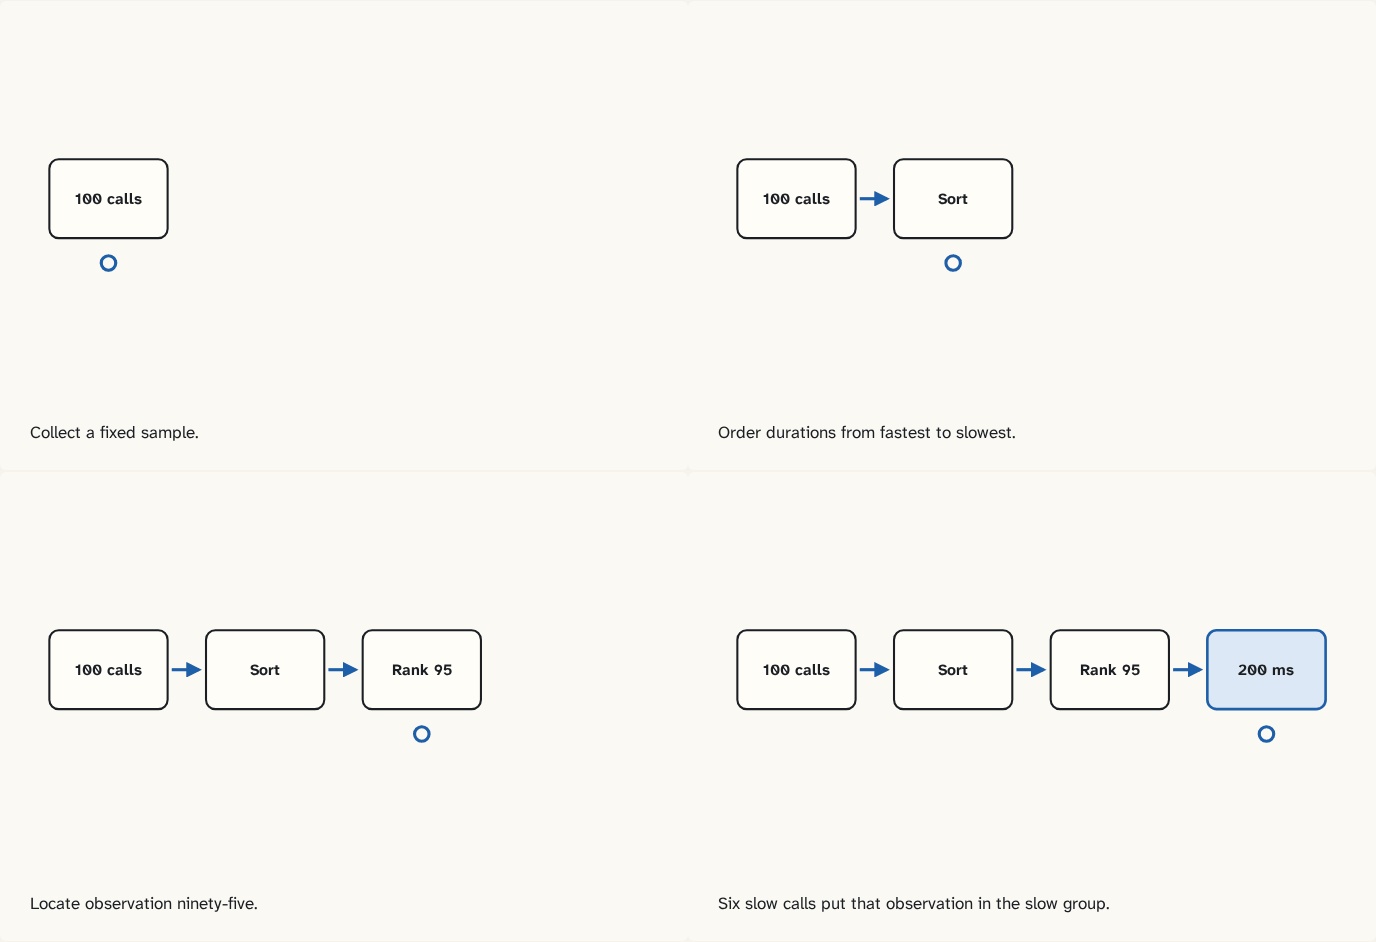
Response time is elapsed time from sending a request to receiving its response. A route usually answers in ten milliseconds. Six of a hundred requests now take two hundred. Which measurement exposes the slow group?
See it
Scroll sideways to see the full diagram.
Collect a fixed sample.
Step 1 of 4Order durations from fastest to slowest.
Step 2 of 4Locate observation ninety-five.
Step 3 of 4Six slow calls put that observation in the slow group.
Step 4 of 4
The building block
Sort the hundred timings. Using nearest rank, the ninety-fifth percentile is the value at position 95. Here it is 200 milliseconds even though the mean is only 21.4. Record request count and failures separately. A fast error can lower mean response time while availability worsens. A log gives details for one event, a metric aggregates events, and a trace connects steps of one request. Compare a database span with total request time before blaming the database.
Calculate the threshold by hand
For 94 requests at 10 ms and six at 200 ms, total time is 2,140 ms across 100 requests. The mean is 21.4 ms. In sorted order positions 1 through 94 are fast and position 95 is slow. Change one slow request into a fast one: the 95th position drops to 10 ms while five callers still wait 200 ms. Alongside the percentile record the sample size, time window and outcomes. To combine two groups, combine their timings or compatible counts per duration range. Averaging the groups' percentile numbers loses how many requests each supplied.
Try it
Optional local lab
Run the response-time fixture. Reduce the slow group to five and predict the nearest-rank result. Write a service objective with a time window and an error threshold.
Check yourself
Sources
What you now know
A percentile describes an ordered sample. Averages can hide a slow group.
Answer every question above correctly to unlock the next puzzle.
Something wrong or unclear on this page? Tell me: a puzzle that didn't click is a bug in the puzzle.