Performance, under the hood · Puzzle 9 · 10 of 10
What a heap dump proves
Puzzle 8's collector frees everything it can't reach. So how does memory get stuck in a garbage-collected app? Here's what a snapshot of memory records, the two sizes it shows, and the chain that proves memory is stuck.
The problem
After rotating the phone ten times, your app uses 80 MB more than at start. The garbage collector frees everything that's unreachable, so whatever is left must still be reachable. From where? And which object, among millions, is the one to fix?
See it
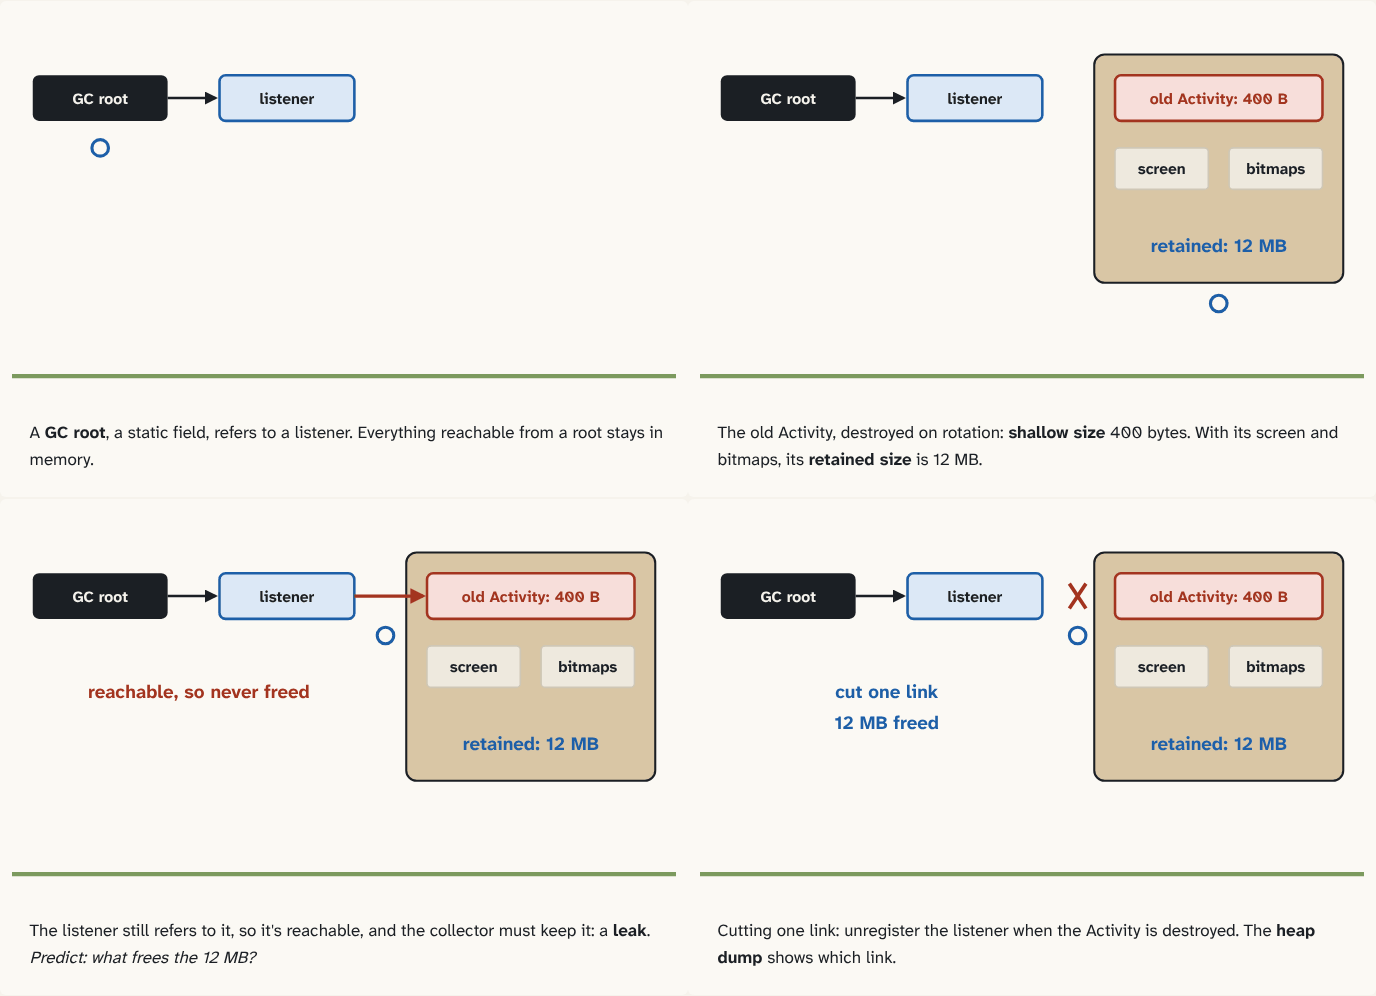
A GC root, a static field, refers to a listener. Everything reachable from a root stays in memory.
Step 1 of 4The old Activity, destroyed on rotation: shallow size 400 bytes. With its views and state, its retained size is 12 MB.
Step 2 of 4The listener still refers to it, so it's reachable, and the collector must keep it: a leak. Predict: what frees the 12 MB?
Step 3 of 4Cutting one link: unregister the listener when the Activity is destroyed. The heap dump shows which link.
Step 4 of 4
The building block
A heap dump is a snapshot of every object in your app's heap, with every reference between them. Android Studio lists them by class with two sizes:
- Shallow size: the memory one object takes by itself, its own fields. An Activity is a few hundred bytes.
- Retained size: the memory that would be freed if this object were freed: itself, plus everything only it keeps alive. That same Activity can retain megabytes: its views and its Compose state. (Bitmap pixels live in native memory, memory outside the heap that the garbage collector doesn't manage, shown separately as Native Size.)
The collector starts from the GC roots (puzzle 7): local variables of running threads, static fields, and the like. Whatever it reaches stays; the rest is freed. So a leak in a garbage-collected app is an object you're finished with that's still reachable from a root.
The classic case: on rotation, your Activity is destroyed and a new one created (the Android course, module 4). If a long-lived object, such as a listener registered in a companion object or a singleton, still refers to the old Activity, the old Activity stays reachable, and everything it retains stays too. Ten rotations, ten old Activities.
The heap dump proves it. Android Studio's "Show activity/fragment leaks" filter finds destroyed Activities still in memory. For each instance it shows its depth, the shortest number of references from a GC root, and the reference chain. Cut one link in that chain, usually by unregistering the listener when the Activity is destroyed, and the whole retained size is freed.
The analogy
A hotel cleans every room whose guest has checked out (the collector). A guest who left but whose name is still on a booking (a reference from a root) keeps the room, and everything in it, forever. The booking list is the chain: cancel that one booking, and the whole room is freed.
Check yourself
Sources
- Android Studio: Capture a heap dump ("Shallow Size: Size of this instance in Java memory. Retained Size: Size of memory that this instance dominates"; "Depth: The shortest number of hops from any GC root to the selected instance"; "Show activity/fragment leaks: Shows classes that are causing memory leaks"; "leaking the host Activity will retain the entire Compose hierarchy and all active state trees in memory"; "Long-lived references to Activity or Context")
- Android Developers: Overview of memory management ("Garbage collection has two goals: find data objects in a program that cannot be accessed in the future; and reclaim the resources used by those objects.")
What you now know
A heap dump is a snapshot of every object and who refers to whom. Shallow size is one object alone; retained size is everything that would be freed with it. A leak is an object you're done with that's still reachable from a GC root, often a destroyed Activity held by something long-lived. The path from the root shows exactly which reference to cut.
Answer every question above correctly to unlock the next puzzle.
That's everything published so far
You've reached the last puzzle of Performance, under the hood. Next: Module 3: Measuring for real, about macrobenchmark and why one run proves nothing; baseline profiles and what ART compiles ahead of time; startup traced end to end; reading a Perfetto trace with SQL.
New puzzles are announced on LinkedIn and in the learning log feed.
Something wrong or unclear on this page? Tell me: a puzzle that didn't click is a bug in the puzzle.