Performance, under the hood · Puzzle 3 · 4 of 10
Reading the flames
The profiler draws the same recording two ways. In one, left to right is time; in the other, it isn't. Here's how to read each, and where a slow function really spends its time.
The problem
In puzzle 2 you recorded a slow scroll. The profiler now shows a mountain of coloured bars. onBind() is wide, parseJson() inside it is wide, and format() appears three times in one chart and once, very wide, in another. Which bar is the one to fix?
See it
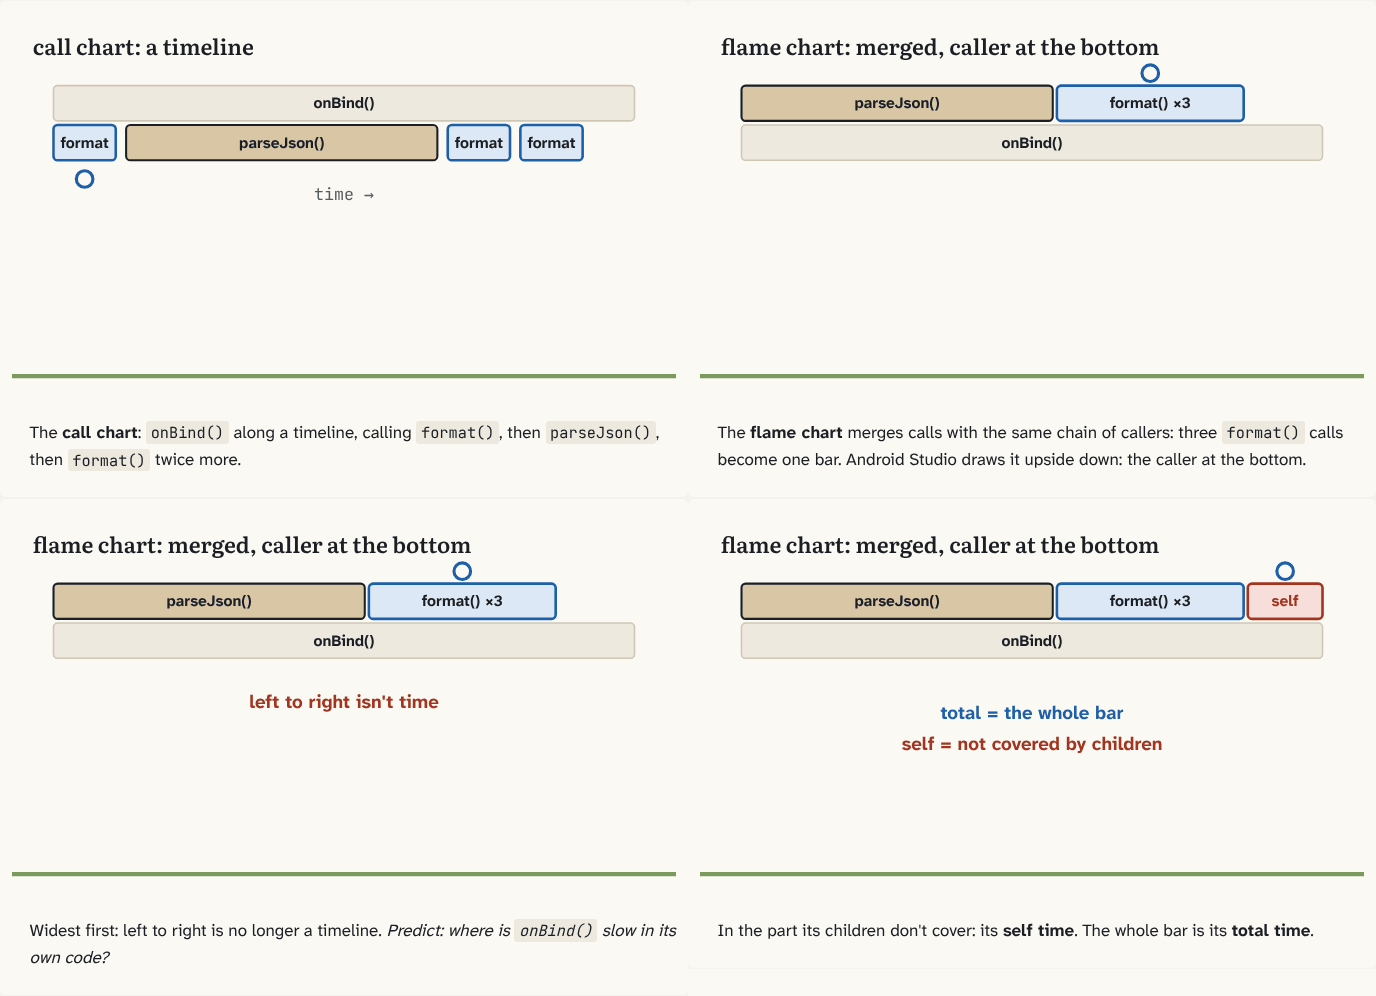
The call chart:
onBind()along a timeline, callingformat(), thenparseJson(), thenformat()twice more.Step 1 of 4The flame chart merges calls with the same chain of callers: three
format()calls become one bar. Android Studio draws it upside down: the caller at the bottom.Step 2 of 4Widest first: left to right is no longer a timeline. Predict: where is
onBind()slow in its own code?Step 3 of 4In the part its children don't cover: its self time. The whole bar is its total time.
Step 4 of 4
The building block
The call chart is a timeline. Each call is a bar from when it started to when it ended, and the functions it called, its callees, sit underneath it. If onBind() calls format() three times, you see three separate format() bars, one after another.
The flame chart takes the same recording and merges every call that has the same chain of callers into one bar. The three format() calls, all called from onBind(), become one bar as wide as the three together. Now width means "how much time in total", and left to right is no longer a timeline: the widest children are drawn first. That's why it's the fastest way to see where time goes.
Two numbers read the bars:
- Total time: the whole bar, the function plus everything it called.
- Self time: only the function's own code, the part of its bar not covered by children.
Start at the first caller's bar. (In Android Studio it's at the bottom: the flame chart is drawn upside down, callees stacked above their caller.) A wide bar whose child is just as wide is slow because of the child: follow the child. A bar noticeably wider than all its children together has self time: that's code to fix in that function.
The bottom-up view answers the opposite question: for a function that's slow everywhere, who calls it, and how much each caller spends.
The analogy
A call chart is your day in a calendar: every meeting at its time. A flame chart is the same week summarised by type: "meetings with Anna: 6 hours", one block, no times. You can't tell when, but you see at a glance where the week went.
Check yourself
Sources
- Android Studio: Flame chart ("identical methods or functions that share the same sequence of callers are collected and represented as one longer bar in a flame chart"; "the horizontal axis doesn't represent a timeline; instead, it indicates the relative amount of time each method or function takes to execute"; "the callees that consume the most CPU time appear first")
- Android Studio: Top down and bottom up charts ("Self: the time the method or function call spent executing its own code and not that of its callees"; "Total: the sum of the method's Self and Children time"; "The Bottom Up tab displays a list of calls in which expanding a function or method's node displays its callers.")
What you now know
A call chart draws each call along a timeline, callees under their caller. A flame chart merges identical call stacks into one bar, so width means total time and left to right means nothing. A wide bar with a wide child is slow because of the child; a bar wider than all its children is slow in its own code: its self time.
Answer every question above correctly to unlock the next puzzle.
Something wrong or unclear on this page? Tell me: a puzzle that didn't click is a bug in the puzzle.