Performance, under the hood · Puzzle 1 · 2 of 10
What a trace is
Every performance tool in this course ends up drawing the same picture: rows of coloured bars over time. Before reading any of them, here's what that recording is, who writes it, and how to read one row.
The problem
You want to know why your app's startup takes 900 ms. A number like "CPU usage 60%" says something is busy but not what, or when. You need a recording that says, moment by moment, what each thread was doing. What does such a recording contain, and how do you read it?
See it
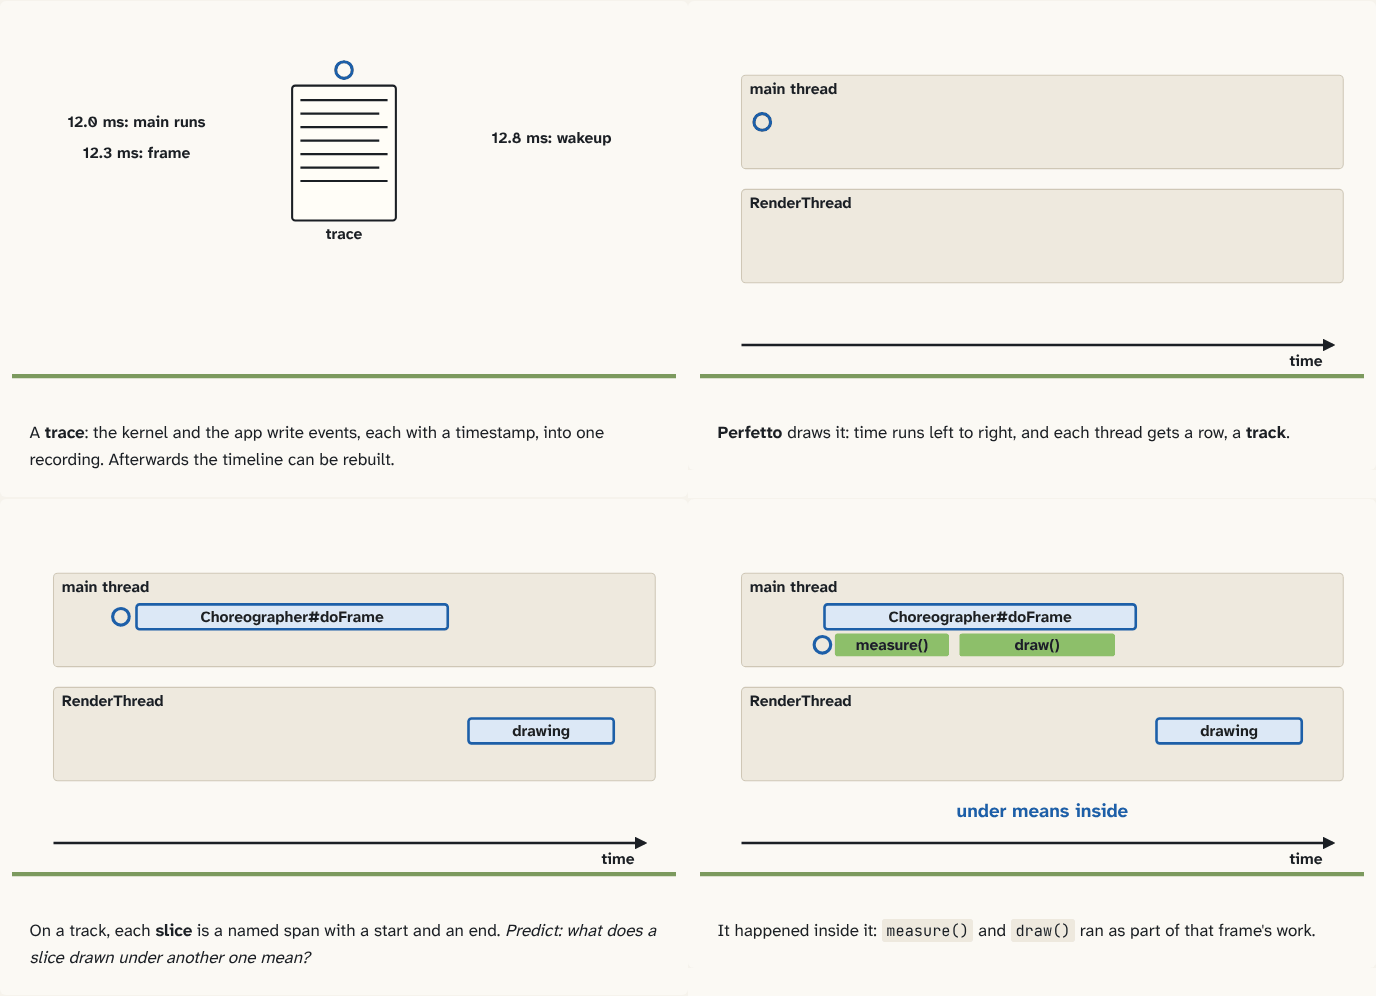
A trace: the kernel and the app write events, each with a timestamp, into one recording. Afterwards the timeline can be rebuilt.
Step 1 of 4Perfetto draws it: time runs left to right, and each thread gets a row, a track.
Step 2 of 4On a track, each slice is a named span with a start and an end. Predict: what does a slice drawn under another one mean?
Step 3 of 4It happened inside it:
measure()anddraw()ran as part of that frame's work.Step 4 of 4
The building block
A trace (a system trace, when it covers the whole phone) is one continuous recording of events, each with a timestamp. The kernel writes down events like "this thread started running on core 2" and "this thread was woken" (the turns from puzzle 0), and apps and Android add their own, like "a frame started". Afterwards, those events are enough to rebuild the timeline: what happened, on which thread, in what order, for how long. That's the difference from a single number like CPU usage: a number says how much, a trace says what and when.
On Android the tool for this is Perfetto: it records traces on the phone and draws them in a web page you open in your browser. Android Studio's system trace uses it too.
Every trace view reads the same way:
- Time runs left to right. Zoom in and you can see microseconds.
- Each thread gets its own row, a track, grouped under its app's process.
- On a track, a slice is a bar with a name, a start and an end: something that happened during that span, like
Choreographer#doFrame, the work for one frame. A slice drawn under another one happened inside it:measure()underChoreographer#doFrameran as part of that frame.
Some slices come from Android: it marks spans like frames, and the kernel's recording draws when each thread ran. You can add your own too, and the next puzzle shows how.
The analogy
A trace is a flight recorder for the phone: it writes down every event with the time, so after landing you can replay the flight. Perfetto is the replay screen: one lane per crew member (track), each task as a labelled block (slice).
Check yourself
Sources
- Perfetto: What is tracing? ("Tracing involves collecting highly detailed data about the execution of a system. A single continuous session of recording is called a trace file or trace for short."; "Traces contain enough detail to fully reconstruct the timeline of events. They often include low-level kernel events like scheduler context switches, thread wakeups, syscalls, etc."; "Metrics are numerical values which track the performance of a system over time.")
- Perfetto: CPU Scheduling events ("The UI represents individual scheduling events as slices"; "the scheduling events also create one track for each thread")
What you now know
A trace is one continuous recording of timestamped events, detailed enough to rebuild the timeline afterwards: which thread ran on which core, when threads woke, and the spans the app marked. Perfetto records and shows Android traces. Time runs left to right; each thread gets a track; on it, each slice is a named span with a start and an end, and a slice drawn under another happened inside it.
Answer every question above correctly to unlock the next puzzle.
Something wrong or unclear on this page? Tell me: a puzzle that didn't click is a bug in the puzzle.