Performance, under the hood · Puzzle 2 · 3 of 10
A photo or a diary
Android Studio offers to take snapshots of what your app is running, or to record every method. They answer different questions, and one of them changes the timings it measures. Here's what each actually records.
The problem
Scrolling your list feels slow. You open the profiler and it asks you to choose: take snapshots of what's running, or record every Java/Kotlin method. Both draw charts that look alike. Which one tells the truth about where the time went, and what does each cost your app while it runs?
See it
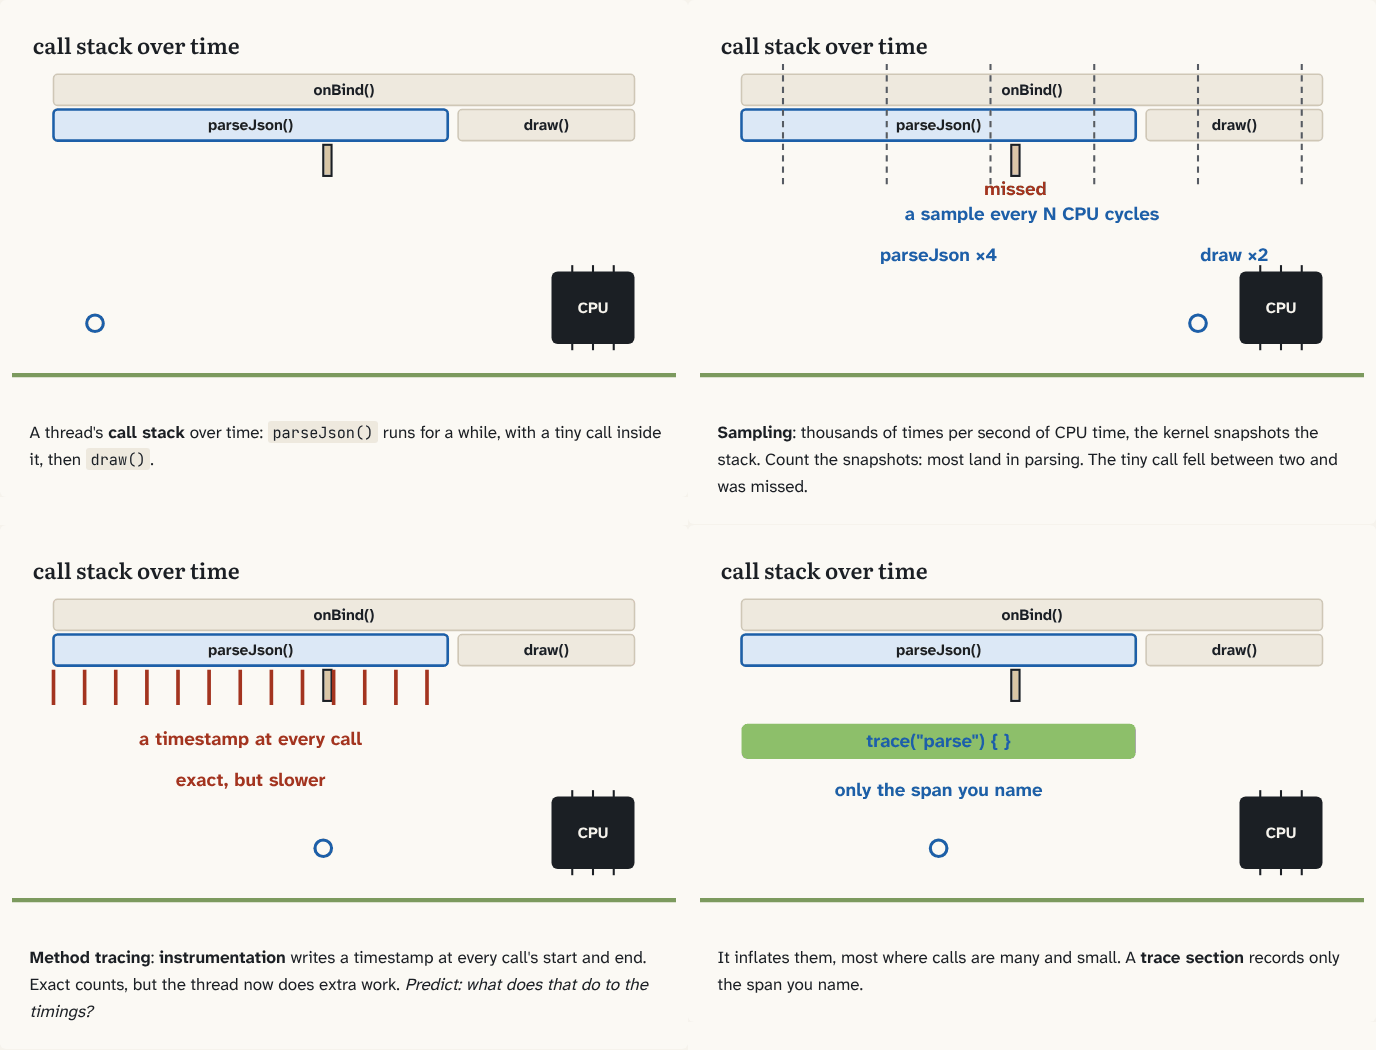
A thread's call stack over time:
parseJson()runs for a while, with a tiny call inside it, thendraw().Step 1 of 4Sampling: thousands of times per second of CPU time, the kernel snapshots the stack. Count the snapshots: most land in parsing. The tiny call fell between two and was missed.
Step 2 of 4Method tracing: instrumentation writes a timestamp at every call's start and end. Exact counts, but the thread now does extra work. Predict: what does that do to the timings?
Step 3 of 4It inflates them, most where calls are many and small. A trace section records only the span you name.
Step 4 of 4
The building block
Every thread has a call stack: the chain of calls it's inside right now, from the first caller down to the function that's running.
Sampling doesn't touch your code. The profiler asks the kernel, and the kernel asks the CPU's counters: each time a given number of CPU cycles, ticks of the processor's clock, pass (by default about 4,000 times per second of running), the kernel stops the thread for an instant and writes down its call stack. That snapshot is a sample. Thousands of them later, a function that shows up in 30% of the samples took about 30% of the time. It's cheap, and it sees native code too: code compiled straight to the processor's instructions, like the C and C++ that ART and Android itself are written in. It only samples a thread while it's running on a CPU, so time spent waiting is invisible. But it's statistics: a call that starts and ends between two snapshots may never appear, and it can't tell you how many times something was called.
Method tracing works by instrumentation: ART injects a timestamp at the entry and exit of every method. Now you get exact calls and exact counts. The price: that extra code runs on every call, so a function made of many tiny calls looks slower than it is. Android's docs say to keep these recordings to five seconds or less, and warn that timings may differ from production.
The third tool is yours: a trace section. Wrap a span in trace("loadAndProcessData") { } and, when you record a trace (puzzle 1), it appears as a slice with that name on your thread's track. You pay only where you put one.
| Sampling | Method tracing | Trace section | |
|---|---|---|---|
| Records | a call stack every N events | every method's start and end | spans you name |
| Exact counts | no | yes | yes, for your spans |
| Slows the app | barely | a lot | barely |
The analogy
Sampling is a photographer who snaps the kitchen every minute: from a day of photos you know the cook spent most of it at the stove, but not how many eggs were cracked. Method tracing is a cook who writes in a diary before and after every move: complete, but the cooking gets slower. A trace section is a timer the cook starts only for the soup.
Check yourself
Sources
- simpleperf: How simpleperf works ("The kernel enables counters while the profiled processes are running. Each time a given number of events happen, the kernel dumps a sample to the mapped buffers.")
- Android Studio: Record Java/Kotlin methods ("the Android Studio Profiler uses runtime instrumentation to inject timestamps at the entry and exit points of each method call"; "We recommend limiting recordings to five seconds or less to avoid performance overhead from runtime instrumentation"; "The timing information from tracing might deviate from production due to the overhead introduced by the instrumentation itself.")
- Android Studio: Sample the callstack ("the callstack usually includes not just the Java/Kotlin code but also the native code required to run the program itself"; "Internally, Android Studio uses simpleperf")
- Android Developers: Define custom events ("Jetpack provides a tracing API that you can use to label a particular section of code"; "The trace function automatically ends the trace when the lambda completes.")
What you now know
Sampling asks the kernel to snapshot a thread's call stack every so many CPU events; counting the snapshots shows where time goes, cheaply, but short calls can be missed. Method tracing injects a timestamp at every method's start and end: exact counts, but the instrumentation slows the app and skews the timings. Trace sections mark only the spans you choose.
Answer every question above correctly to unlock the next puzzle.
Something wrong or unclear on this page? Tell me: a puzzle that didn't click is a bug in the puzzle.