Performance, under the hood · Puzzle 3 · 4 of 6
The late frame
The Android course showed that a frame must be ready before the next vsync. Perfetto draws that limit for every frame, next to when the frame really finished. Here's how to read the two lines, and tell your app's lateness from someone else's.
The problem
Users say scrolling stutters, but only sometimes. In a trace there are hundreds of frames. Which ones were late, by how much, and was it your app's fault, or the display side's?
See it
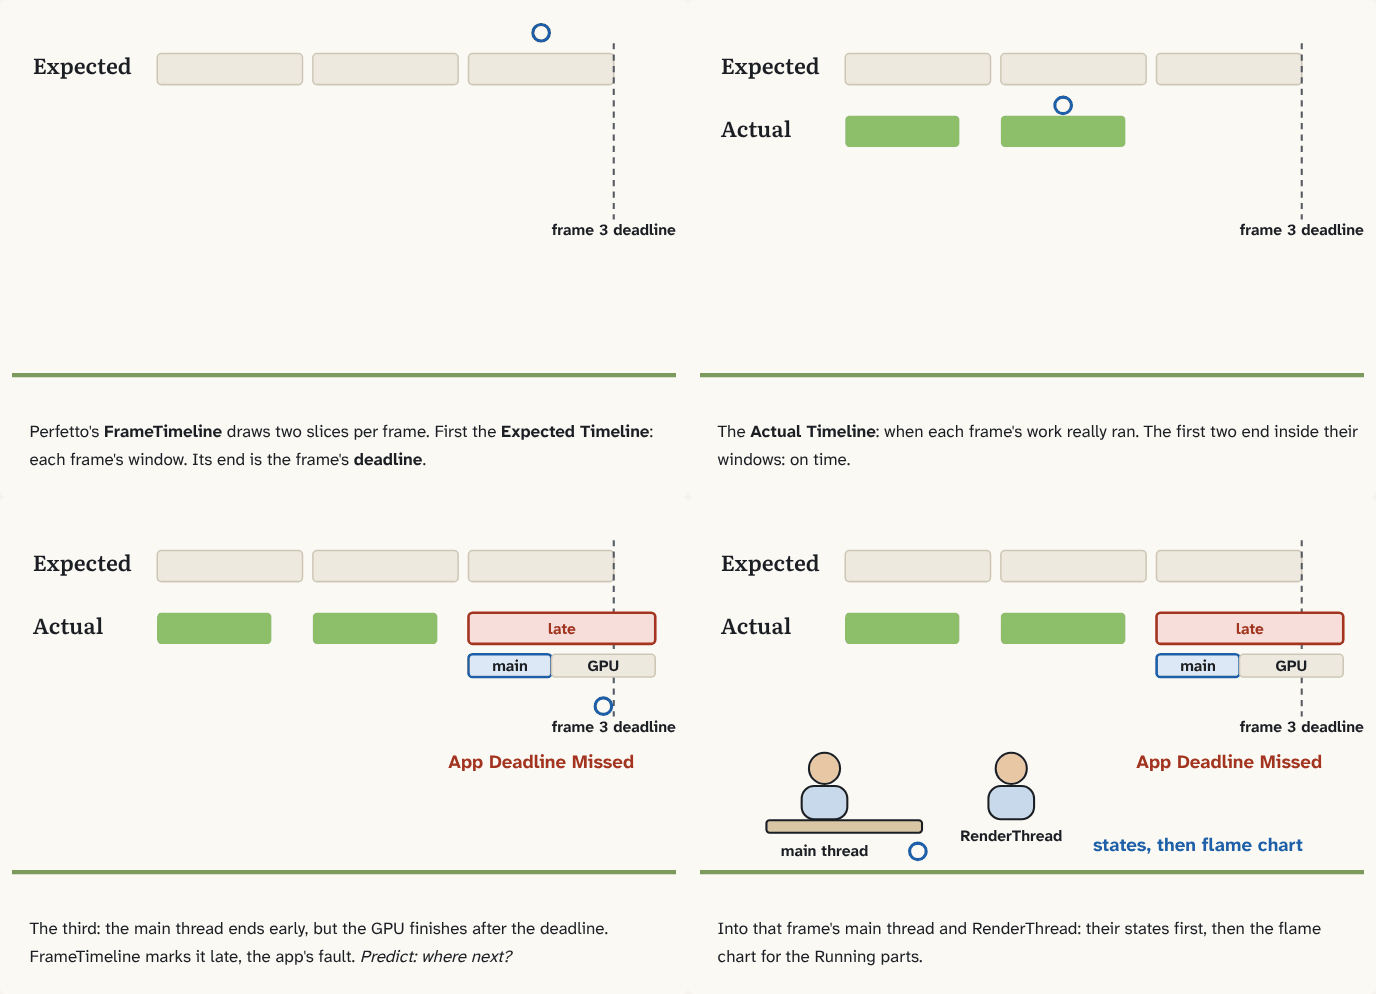
Perfetto's FrameTimeline draws two slices per frame. First the Expected Timeline: each frame's window. Its end is the frame's deadline.
Step 1 of 4The Actual Timeline: when each frame's work really ran. The first two end inside their windows: on time.
Step 2 of 4The third: the main thread ends early, but the GPU finishes after the deadline. FrameTimeline marks it late, the app's fault. Predict: where next?
Step 3 of 4Into that frame's main thread and RenderThread: their states first, then the flame chart for the Running parts.
Step 4 of 4
The building block
In the Android course you saw a frame's work: the main thread measures, lays out and draws, the RenderThread hands it to the GPU, and the result must be ready for the next vsync. Since Android 12, Perfetto's FrameTimeline draws that contract for each frame, as two slices under your app:
- Expected Timeline: the window the app was given for this frame. It starts when the Choreographer callback was scheduled; its end is the frame's deadline.
- Actual Timeline: what really happened. It starts when
Choreographer#doFramestarted running and ends at whichever came later: the frame being posted to SurfaceFlinger (the RenderThread hands the finished frame over), or the GPU finishing.
When Actual ends after the deadline, the frame is janky, and FrameTimeline labels whose fault it was. "App Deadline Missed" means your app ran longer than expected. Other labels blame SurfaceFlinger or the display, and "Buffer Stuffing" means your app queued frames faster than they could be shown.
Notice that the GPU counts. A frame whose main thread finished early can still be late if the GPU work was too heavy.
So the method is: find the late frames on the Actual Timeline, then zoom into that frame's main thread and RenderThread. Read their states (puzzle 2) first, then the flame chart (puzzle 1) for the Running parts.
The analogy
A train timetable next to the actual arrival board. The timetable (Expected) says when each train should arrive; the board (Actual) says when it did. A late train is easy to spot, and the board even says whether it was the driver or the station.
Check yourself
Sources
- Perfetto: Android Jank detection with FrameTimeline ("FrameTimeline requires Android 12(S) or higher"; "Expected Timeline: Each slice represents the time given to the app for rendering the frame… The start time is the time the Choreographer callback was scheduled to run"; "Actual Timeline: These slices represent the actual time an app took to complete the frame (including GPU work) and send it to SurfaceFlinger for composition… The end time of the slices here represent max(gpu time, post time)"; "AppDeadlineMissed: The app ran longer than expected causing a jank.")
- Android Studio: UI jank detection (the threads relevant to a janky frame: "the UI thread, RenderThread, and the GPU completion thread")
What you now know
FrameTimeline gives every frame two slices: the Expected Timeline, the window the app was given, and the Actual Timeline, from Choreographer's callback to when the frame was posted and the GPU finished. Actual past the deadline is jank; FrameTimeline says whether the app or SurfaceFlinger was late. Then read the late frame's main thread and RenderThread: states, then flame chart.
Answer every question above correctly to unlock the next puzzle.
Something wrong or unclear on this page? Tell me: a puzzle that didn't click is a bug in the puzzle.