Performance, under the hood · Puzzle 2 · 3 of 6
Slow isn't always busy
A trace section on your main thread takes 120 ms, but a sample of the same moment shows almost nothing running. Both are right. Here's the line under every thread in a system trace that explains it.
The problem
You wrapped loadUser() in a trace section (puzzle 0) and it's 120 ms long, on the main thread, during startup. You sample the same moment: the main thread's stack barely shows up, as if it did nothing. Is the code slow, or not?
See it
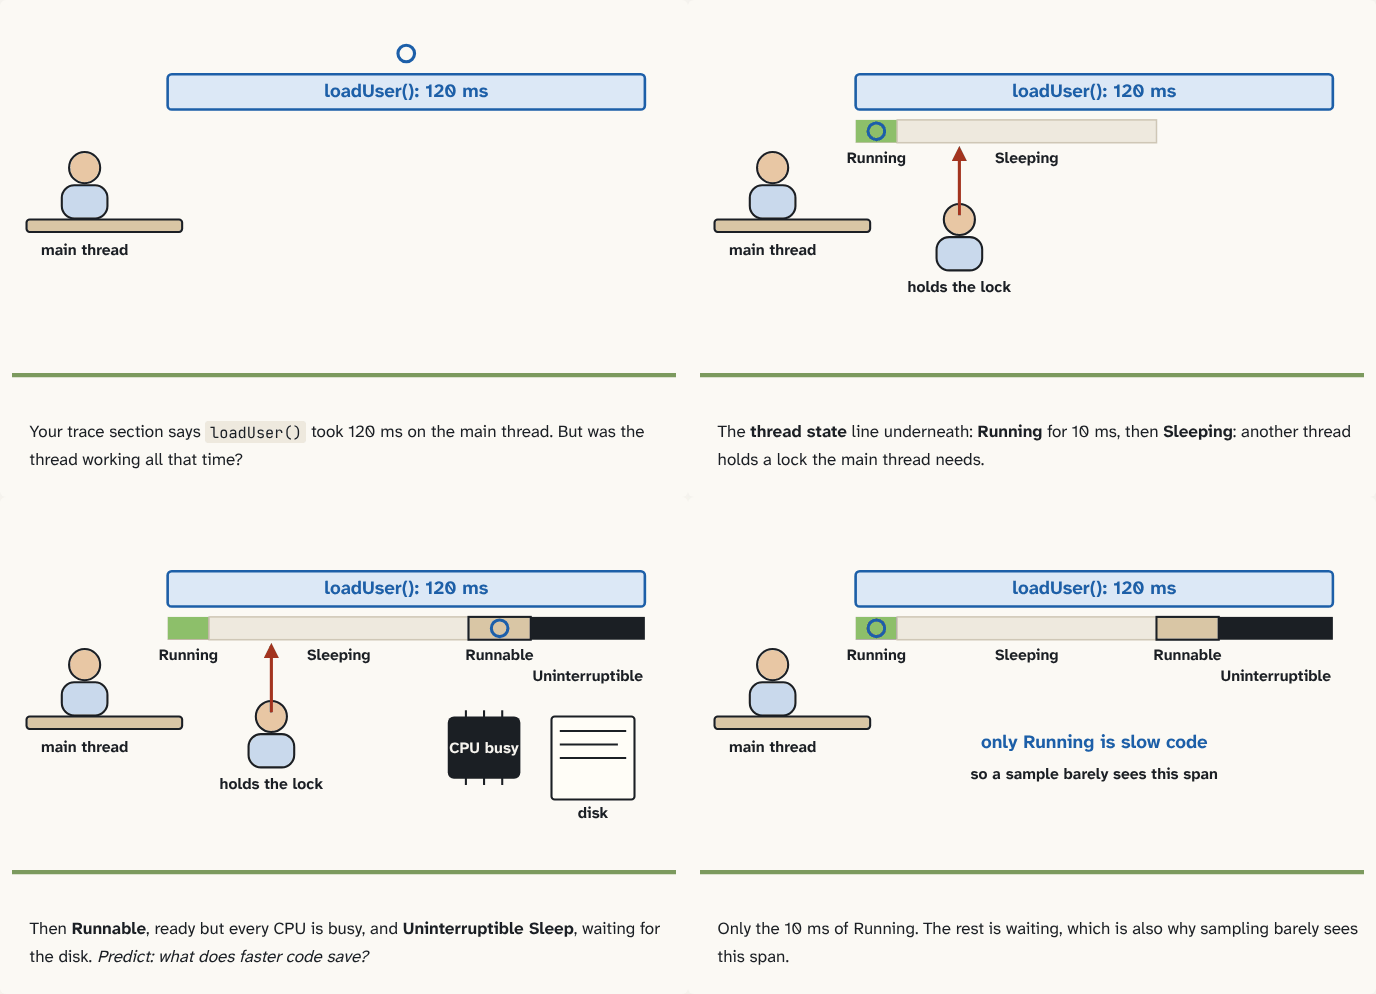
Your trace section says
loadUser()took 120 ms on the main thread. But was the thread working all that time?Step 1 of 4The thread state line underneath: Running for 10 ms, then Sleeping: another thread holds a lock the main thread needs.
Step 2 of 4Then Runnable, ready but every CPU is busy, and Uninterruptible Sleep, waiting for the disk. Predict: what does faster code save?
Step 3 of 4Only the 10 ms of Running. The rest is waiting, which is also why sampling barely sees this span.
Step 4 of 4
The building block
A span on a timeline says when something started and ended. It doesn't say whether the thread was working. For that, a system trace draws a coloured state line on every thread's track: its thread state, as the kernel's scheduler records it.
- Running: the thread is on a CPU, executing. Only this time is "your code being slow".
- Runnable: ready to run, but every CPU is busy with other threads. It waits its turn.
- Sleeping: nothing to do until something happens: a lock held by another thread, a Binder reply from another process, a message.
- Uninterruptible Sleep: waiting inside the kernel, usually for disk I/O to complete.
Sampling (puzzle 0) only fires while a thread is on a CPU, so a thread that isn't Running collects almost no samples. That's why your 120 ms span barely shows: most of it the main thread was asleep.
So before you optimise a slow span, read its states. Mostly Running: make the code faster, the flame chart (puzzle 1) shows where. Mostly Sleeping: find who it's waiting for; the trace shows which thread woke it. Mostly Uninterruptible Sleep: it's reading the disk, so move that off the main thread. Mostly Runnable: other threads, maybe your own, are keeping the CPUs busy.
The analogy
A waiter is away from your table for ten minutes. Was he slow to carry plates (Running)? Queuing for the one coffee machine (Runnable)? Waiting for the kitchen to call him (Sleeping)? Down in the cellar fetching a bottle (Uninterruptible Sleep)? The ten minutes look the same from your table; only watching him tells you which.
Check yourself
Sources
- Android Developers: Navigate a Systrace report ("Running: The thread is completing work related to a process or is responding to an interrupt. Runnable: The thread is available to run but isn't currently scheduled. Sleeping: The thread has no work to do, perhaps because the thread is blocked on a mutex lock. Uninterruptable sleep: The thread is blocked on I/O or waiting for a disk operation to complete.")
- Perfetto: CPU scheduling events ("When Thread A suspends on the wait() it will enter the state S(sleeping) and get removed from the CPU run queue"; end_state "R Runnable … S Sleeping D Uninterruptible Sleep")
What you now know
A system trace shows each thread's state as the kernel sees it: Running on a CPU, Runnable and waiting for one, Sleeping while blocked on a lock or a reply, or in Uninterruptible Sleep waiting for disk I/O. A slow span that's mostly Running needs faster code; mostly Sleeping or Uninterruptible Sleep, it's waiting on something else; mostly Runnable, other threads have the CPUs.
Answer every question above correctly to unlock the next puzzle.
Something wrong or unclear on this page? Tell me: a puzzle that didn't click is a bug in the puzzle.