CoursesSystem design from first principles to design review
Puzzle 1 · 2 of 19
How much traffic arrives after a concert?
Estimate peak demand and concurrent work with units.
All puzzles in this course
The problem
There are 120,000 daily drivers. Each opens the map ten times and attempts one reservation. Which number belongs in a peak-load test?
See it
Scroll sideways to see the full diagram.
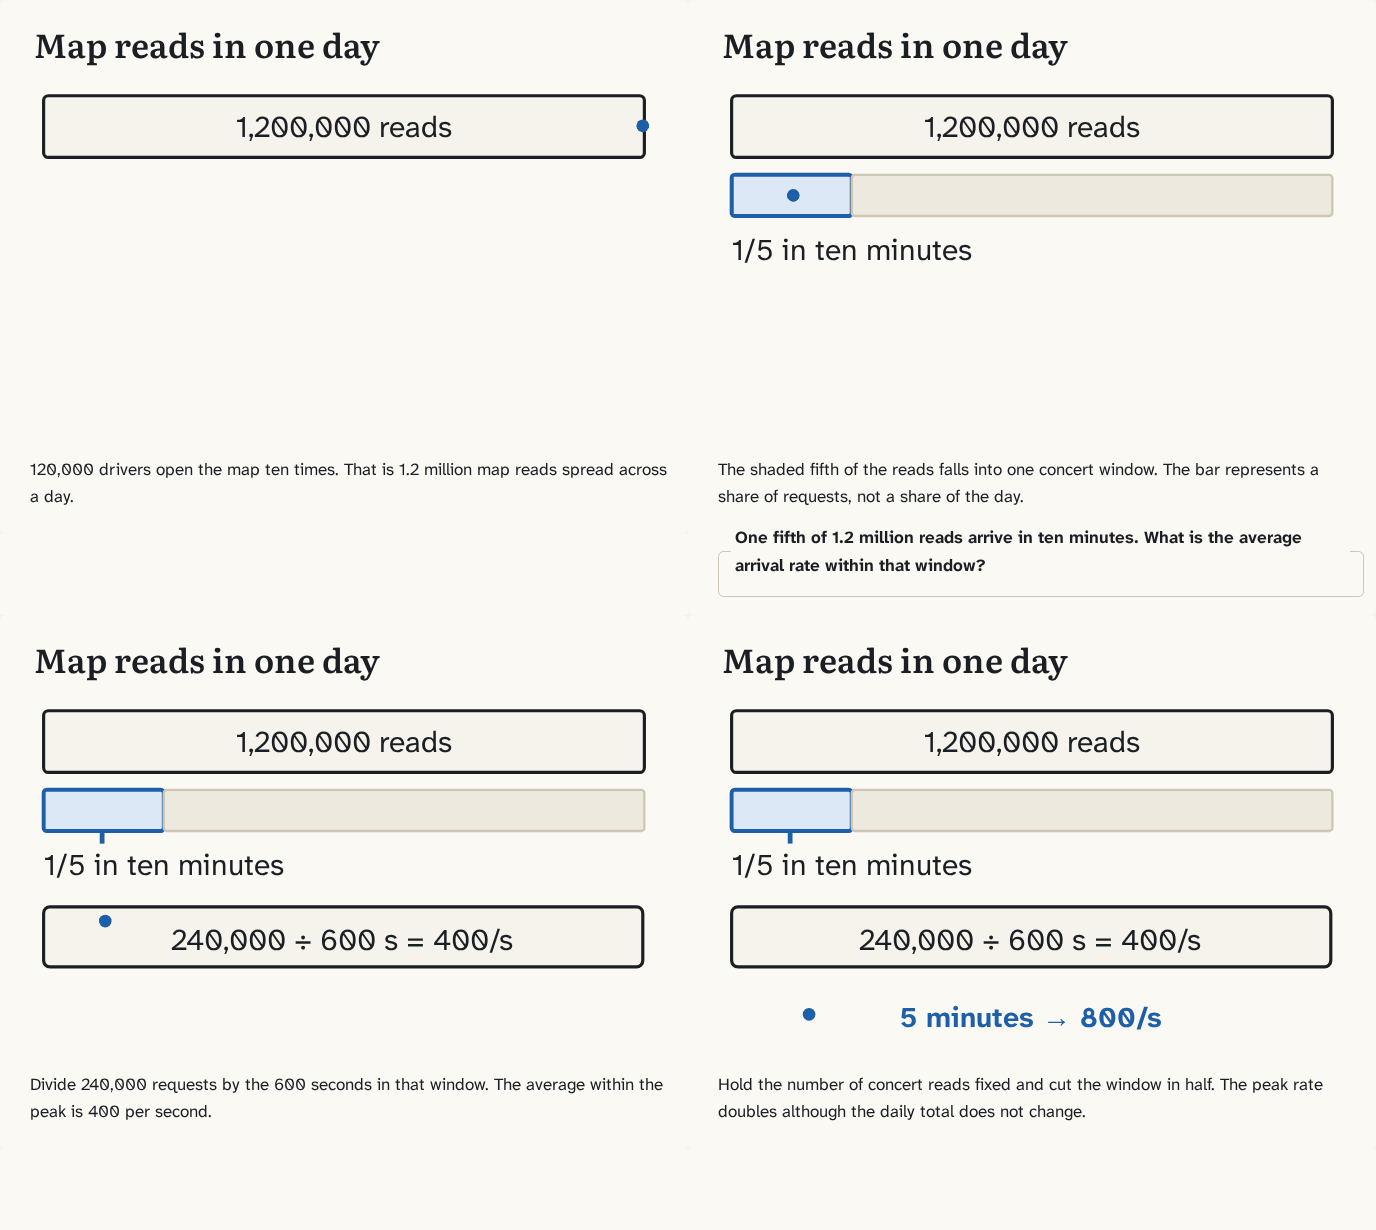
120,000 drivers open the map ten times. That is 1.2 million map reads spread across a day.
Step 1 of 4The shaded fifth of the reads falls into one concert window. The bar represents a share of requests, not a share of the day.
Step 2 of 4Divide 240,000 requests by the 600 seconds in that window. The average within the peak is 400 per second.
Step 3 of 4Hold the number of concert reads fixed and cut the window in half. The peak rate doubles although the daily total does not change.
Step 4 of 4
The building block
There are 86,400 seconds in a day. The averages are about 13.9 map reads and 1.39 reservation attempts per second. Now suppose one fifth of all map reads arrive in the same ten minutes after a concert. That gives 240,000 / 600 = 400 reads per second. The traffic distribution is an assumption. Daily totals alone cannot tell you the peak.
At a stable 400 completed requests per second and a mean of 0.15 seconds from arrival to reply, an average of 60 requests are in flight, meaning they have arrived but their replies are still outstanding. This is Little’s law. Keep the rate and duration inside the same measurement boundary. If each request holds a database connection for only 0.010 seconds, that part of the workload occupies four connections on average. Short bursts can require more.
Find the bottleneck hidden by the daily average
Suppose each map response carries 12,000 bytes. At the 400-per-second peak the service sends 4.8 million bytes each second, about 38.4 million bits per second before protocol overhead. Doubling response size doubles outgoing bandwidth even when the number of database reads stays fixed.
Now assume the backend completes only 350 reads per second for the ten-minute peak. Starting empty, with no abandoned or rejected work, 30,000 requests remain after those ten minutes: 50 unfinished requests per second for 600 seconds. Measuring only completions would understate offered demand. Once the queue keeps growing, stop using the steady-state estimate of 60 outstanding requests.
Go deeperWhat will storage cost in bytes?
At 120,000 accepted sessions per day and 800 bytes of row and index data per session, one day adds 96 million bytes. After 365 days one copy contains about 35.04 billion bytes. Three full copies total about 105.12 billion before backups, engine overhead and spare space. Test the 800-byte assumption by measuring both table and index growth in a representative fixture.
What happens if accepted sessions double at the same retention and size?
One copy grows to about 70.08 billion bytes.
Measure a burst that an average hides
A service records one timestamp for each arriving request. In this small trace a number is seconds since the experiment began. Divide the number by ten and keep the whole part to assign each request to a ten-second bucket. Which bucket should set the minimum load for the next test?
CREATE TABLE arrival (second INTEGER);
INSERT INTO arrival VALUES
  (0), (10), (20), (20), (21), (22), (22), (29);

SELECT (second / 10) * 10 AS bucket_start,
       COUNT(*) AS arrivals,
       COUNT(*) / 10.0 AS requests_per_second
FROM arrival
GROUP BY bucket_start
ORDER BY bucket_start;Eight requests in thirty seconds average about 0.27 per second. The last bucket alone gets six, or 0.6 per second. Change 29 to 30. The request moves to the next bucket because the interval includes its start and excludes its end. A bucket is a measurement choice. Two spikes on opposite sides of a boundary can hit the same database queue. A load test should replay the arrival times if that ordering matters.
Try it
Shorten the peak to five minutes while keeping its total demand. Predict the arrival rate and work in flight before reading on. At the same mean duration the answers are 800 per second and 120 in flight. Measure arrivals, completions and backlog separately to check whether the duration actually holds.
Check yourself
What you now know
Size for a measured burst and use throughput times mean duration to estimate concurrent work.
Answer every question above correctly to unlock the next puzzle.
Suppose the peak needs two service instances. Which one is allowed to grant the last space?
Something wrong or unclear on this page? Tell me: a puzzle that didn't click is a bug in the puzzle.